

- Hip
- Knee
- Ankle
- Shoulder
- Elbow
- Wrist
- Finger
- Clubfoot
- Data Quality
- Methodology
- Colophon
- Previous reports
Survival
Short term revision
Long term revision
Funnel plot of proportion of hip revision arthroplasties within one year after a total hip arthroplasty per hospital in the Netherlands in 2020-2024 (n=169,358)
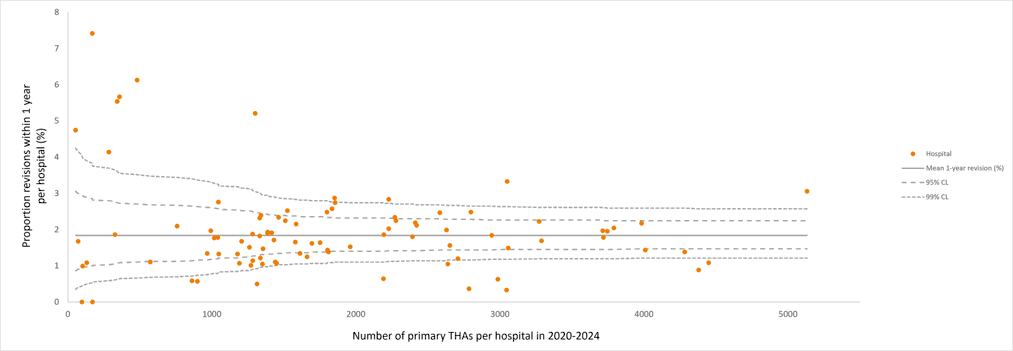
| Please note: The proportions of revisions within 1 year per hospital were adjusted for casemix factors age, gender, ASA score, BMI, smoking, charnley score and diagnosis (osteoarthritis versus other). THA: total hip arthroplasty; CL: control limits. |
The mean 1-year revision percentage is 1.84 in the Netherlands in 2020-2024.
Control limits indicate the plausible range of outcome if all hospitals perform equally well.
Funnel plot of proportion of hip major revision arthroplasties within one year after a total hip arthroplasty per hospital in the Netherlands in 2020-2024 (n=169,358)
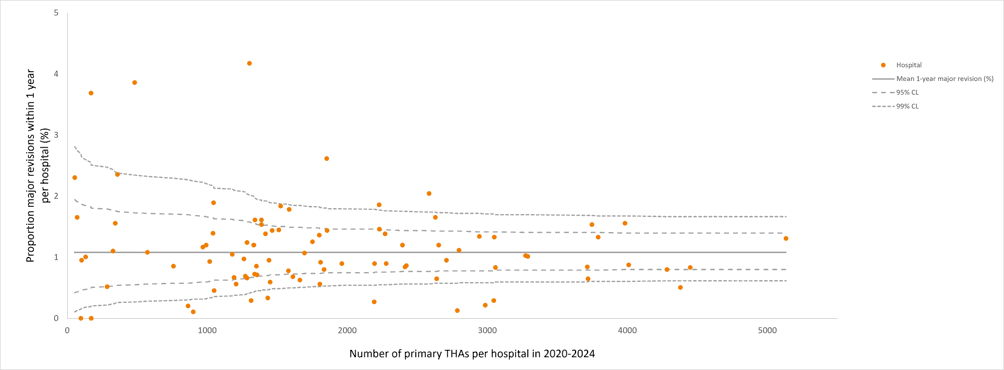
| Please note: Major revision is defined as revision of at least acetabulum or femur compenent. Please note: The proportions of revisions within 1 year per hospital were adjusted for casemix factors age, gender, ASA score, BMI, smoking, charnley score and diagnosis (osteoarthritis versus other). THA: total hip arthroplasty; CL: control limits. |
The mean 1-year major revision percentage is 1.08 in the Netherlands in 2020-2024.
Control limits indicate the plausible range of outcome if all hospitals perform equally well.